[link]
Summary by Tiago Vinhoza 8 years ago
#### Goal:
+ Development and validation of a continuous score for patient assessment (to be used both outside and inside intensive care).
+ Prior work: Modified Early Warning Score (MEWS) identifies 44% of intensive care transfers occurring within the next 12 hours. Generates 69 false positives for each correctly identified event.
#### Dataset:
Model Creation | Model Validation
---------------|------------------
22,265 patients admitted to the *Sarasota Memorial Hospital* (SMH) between Jan/2004 and Dec/2004 | 32341 patients admitted to the SMH between Sep/2007 and Jun/2009
| 45,771 patients admitted to the SMH between Jan/2008 and May/2010
| 32,416 patients admitted to *Abigton Memorial Hospital* (AMH) between Jul/2009 and Jun/2010
| 19,402 patients admitted between Jul/2008 and Nov/2008 in *Hospital C*.
+ ~ 7000 variables, 500 laboratory tests.
+ Constraints:
+ Variables should be related to the patient's condition
+ Collected with some frequency
+ Susceptible to variation during patient stay in the hospital
+ Focus: "How the patient is" not "Who the patient is"
+ The constraints reduce the number of candidate variables to 43 (13 nurse assessments, 6 vital signs and 23 laboratory tests)
#### Rothman Index:
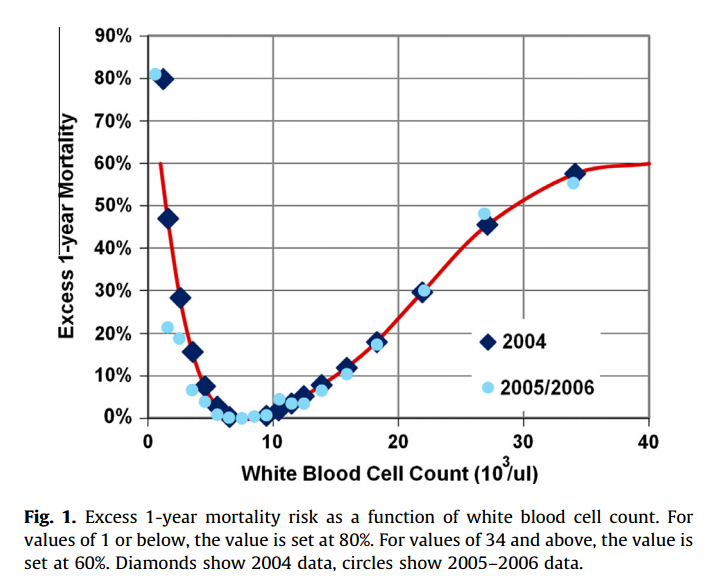
+ The Rothman Index is based on the "Excess Risk" associated with each of the variables:
+ The excess risk is determined by the increase (in percentage points) of the mortality at 1 year identified for that variable. In the best case, the "excess" risk is zero and the Rothman Index equals 100.

+ The excess risk somewhat resembles the *impact coding* for categorical variables. One must always be careful that there is no data snooping.
+ The index consists of the 26 variables below. They were chosen from the 43 candidates using a *forward stepwise logistic regression* with the patients of the model creation dataset (criterion p-value <0.05). Note that the logistic regression is used only to choose the variables. The Rothman Index is not a regression model itself.

+ The lab tests are collected less frequently. The score is divided into two parts (one that takes into account the laboratory variables and another that does not take into account).

+ *TimeSinceLabs* has a maximum value of 48 hours.
#### Results:
+ Outcomes:
+ Mortality in 24h
+ Unplanned readmission in 30 days
+ Discharge
+ Rothman Index is correlated with discharge category (Home, Home healthcare, Rehab, Skilled Nursing Facility, Hospice, Death)
|Mortality in 24h || Readmission in 30 days || Discriminates type of discharge| |
|-------------|-|-----------------------|-|------------------------|-------------------------------|
| Hospital| AUC | Hospital | AUC | Hospital | AUC|
|SMH | 0.933 (0.915-0.930) | SMH | 0.62 (0.61-0.63) | SMH | 0.923 (0.915-0.930)|
|AMH | 0.948 (0.960-0.970) | AMH | *| AMH | 0.965 (0.960-0.970)|
|C | 0.929 (0.919-0.940) | C | *| C| 0.915 (0.900-0.931) |
(*) in the case of readmission in 30 days it was possible to only identify the patients of the SMH hospital.
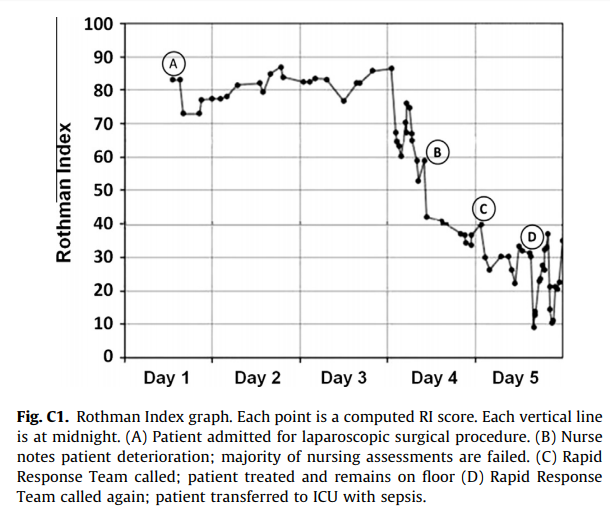
+ Tracking the Rothman Index and correlating it with events during hospital stay:

#### Discussion:
+ Choice of 1-year mortality to calculate excess risk:
+ Instead of in-hospital death, which is relatively rare (approximately 1—2% of patients), the model is based on 1-year post discharge mortality, where death is far more common (approximately 10% of patients).
+ Improve the *signal strength* to determine the relationships between clinical measures and risk.
+ Outcome should be sufficiently frequent and a plausible surrogate for the patient condition. In this case, the risk tries to quantify *distance from death*.
+ The Rothman index is not designed to predict any specific outcome.
+ Caveat: Results should have included precision/recall analysis. For risk assessment it is important to evaluate the rate of false alarms per one true positive.


