[link]
Summary by Tiago Vinhoza 7 years ago
#### Goal
+ Predict 128 diagnoses for intensive pediatric care patients.
#### Dataset:
+ Children's Hospital LA.
+ Episode is a multivariate time series that describes the stay of one patient in the intensive care unit.
Dataset properties | Value
---------|----------
Number of episodes | 10,401
Duration of episodes | From 12h to several months
Time series variables | Systolic blood pressure, Diastolic blood pressure, Peripheral capillary refill rate, End tidal CO2, Fraction of inspired O2, Glasgow coma scale, Blood glucose, Heart rate, pH, Respiratory rate, Blood O2 Saturation, Body temperature, Urine output.
+ Resampling and missing values:
+ Irregularly sampled time-series that is resampled to an hourly rate.
+ Mean measurement within each hour window is taken.
+ Forward- and back-filling are used to fill gaps created by the resampling.
+ When variable time series is missing entirely: imputation with a clinically *normal* value defined by domain experts.
+ This paper is followed by [Modeling Missing Data in Clinical Time Series with RNNs](http://www.shortscience.org/paper?bibtexKey=journals/corr/LiptonKW16) from the same research group.
+ Labels:
+ Each episode is associated with 0 or more diagnoses. (in-house taxonomy, ICD-9 based).
+ Dataset contains 429 diagnoses. The paper focuses on the 128 most frequent diagnoses that appear 50 or more times in the dataset.
#### Architecture:
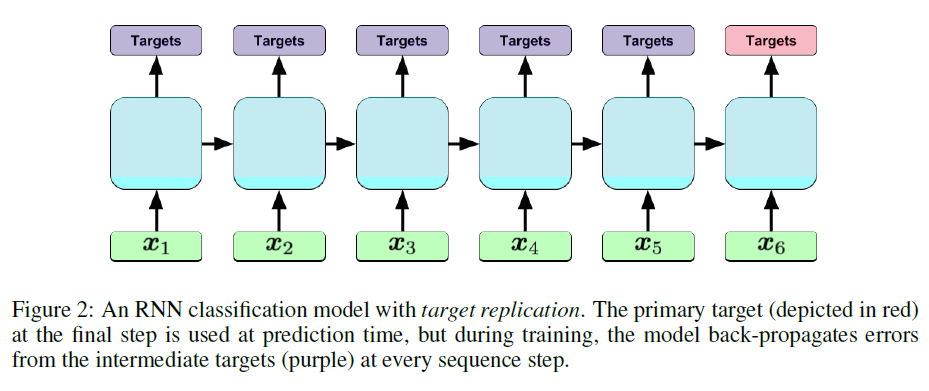
+ LSTM with Target Replication:

+ Loss function:
+ For the model with target replication, output y is generated at every sequence step. The loss function is then a convex combination of the final loss (log-loss in the case of this paper) and the average of the losses over all steps where T is the number of sequence steps and alpha is a hyperparameter.

#### Experiments and Results:
**Methodology**:
+ Split dataset: 80% training, 10% validation, 10% test
+ LTSM trained for 100 epochs via gradient stochastic gradient (with momentum).
+ Regularization L2: 1e-6, obtained via validation dataset.
+ LSTM: 2 hidden layers with 64 cells or 128 cells (and 50% dropout)
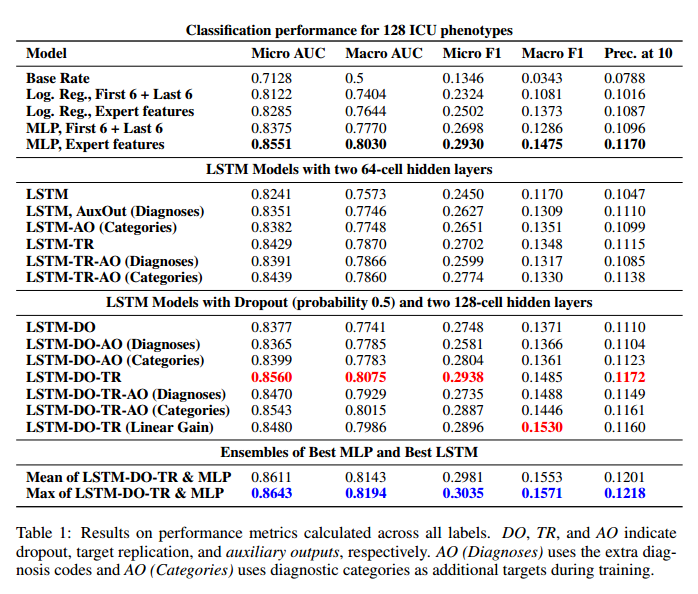
+ Multiple combinations: target replication / auxiliary target variables (trained using the other 301 diagnoses and other clinical information as a target. Inferences are made only for the 128 major diagnoses.
+ Baselines for comparison:
+ Logistic Regression - L2 regularized
+ MLP with 3 hidden layers - ReLU - dropout 50%.
+ Baselines tested in the raw time-series and in a feature engineering version made by domain experts.
*Metrics*:
+ Micro AUC, Micro F1: calculated by adding the TPs, FPs, TNs and FNs for the entire dataset and for all classes.
+ Macro AUC, Macro F1: Arithmetic mean of AUCs and F1 scores for each of the classes.
+ Precision at 10: Fraction of correct diagnoses among the top 10 predictions of the model.
+ The upper bound for precision at 10 is 0.2281 since in the test set there are on average 2.281 diagnoses per patient.
*Results*:

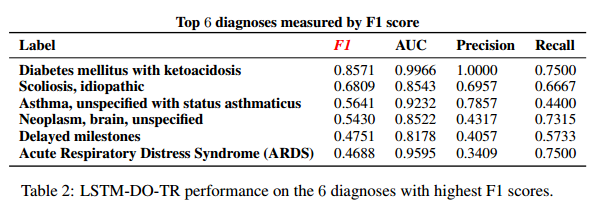
*Results for selected diagnoses*:

#### Discussion:
+ Auxiliary outputs improve performance at the expense of increased training time. Very unbalanced dataset for some of the remaining 301 labels makes it spend an entire epoch only to learn that one of the target variables can take values other than 0.
+ Real-Time Predictions: In the future, the authors expect that the proposed solution could be used to make continuously updated real-time alerts and diagnoses.


